
Services
The Services page is where you manage everything Valet runs behind the scenes — PHP, Nginx, MySQL, and more. You can start and stop individual services, check their resource usage, dig into configuration, and read logs when something isn't working right.
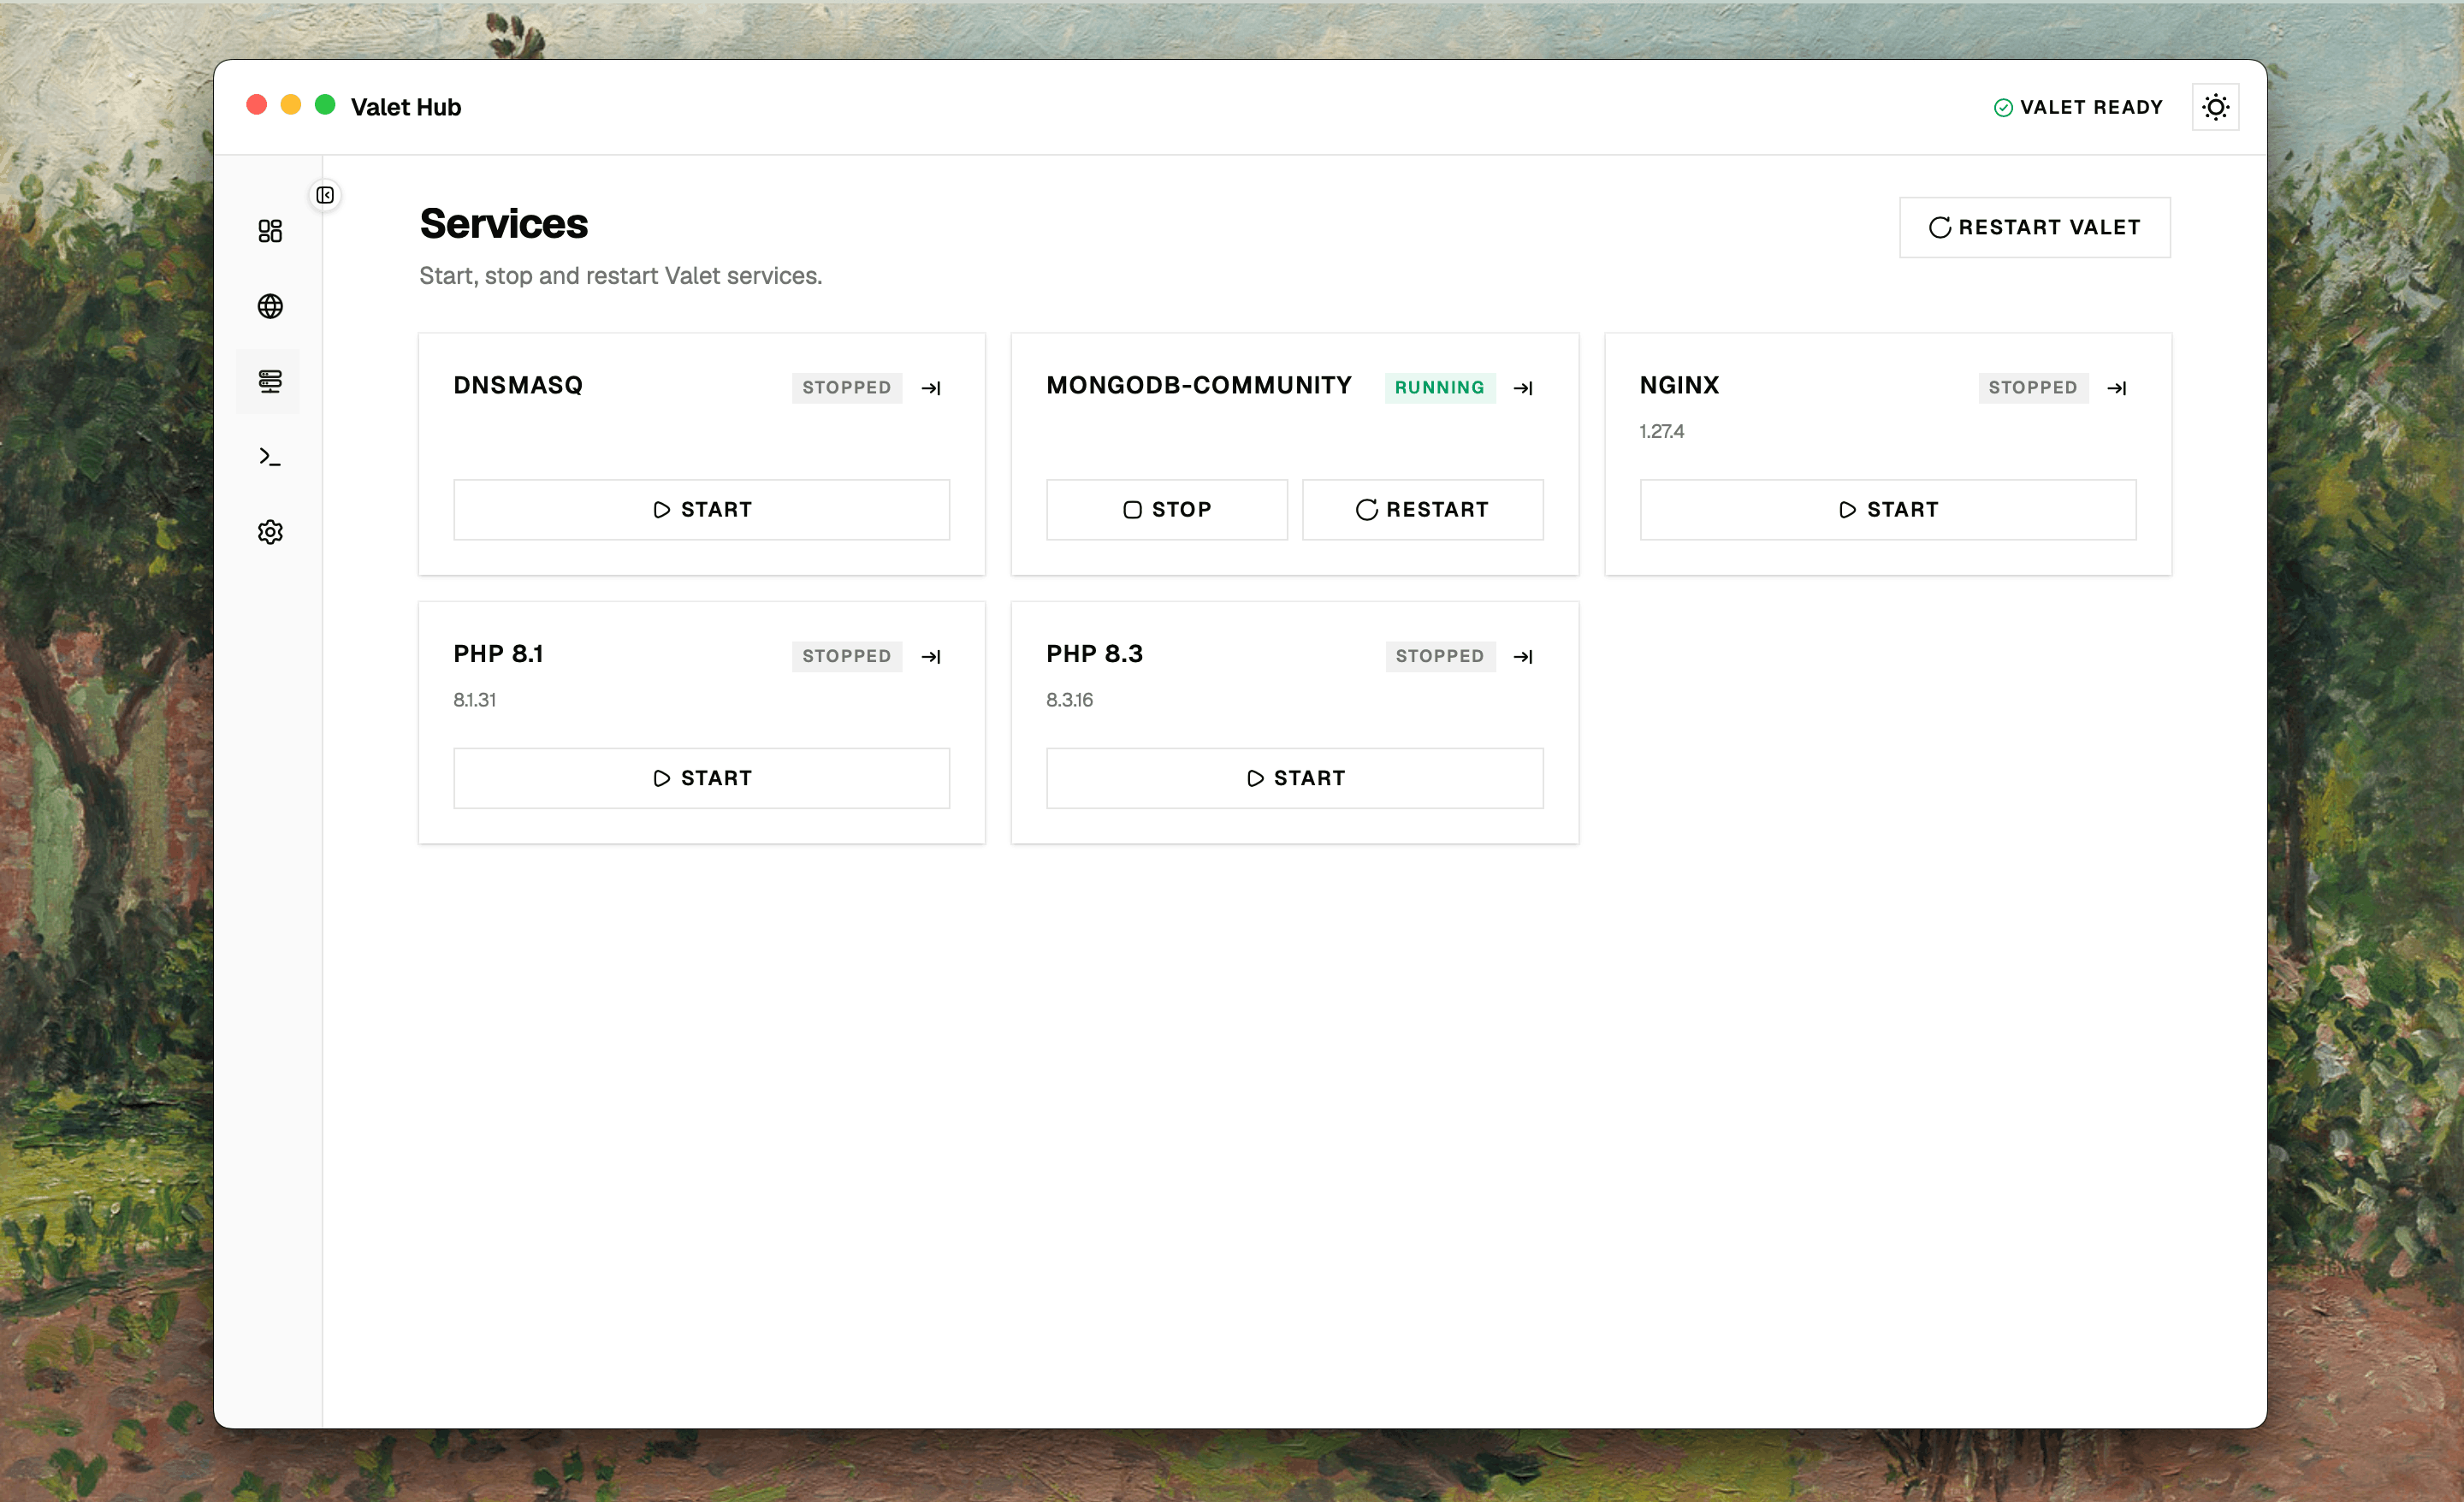
Service Cards
Each service Valet manages appears as a card in a grid. At a glance you can see:
- Name — the service name (e.g. PHP 8.3, Nginx, MySQL).
- Status — a badge that's green when running, gray when stopped, or red when something's wrong.
- Version — the installed version, if available.
Start, Stop, or Restart
What you can do with a service depends on its current state:
- Running — stop or restart it.
- Stopped or errored — start it.
While an action runs, the button shows a spinner and can't be clicked. A notification confirms success or reports an error so you know the result.
Restart All
The Restart Valet button at the top restarts the entire Valet stack in one go. It shows a spinner while processing — useful after changing configuration files or when you want a clean slate.
Service Detail Page
Click any service card to dive deeper. The detail page gives you resource usage, configuration paths, and actions specific to that service.
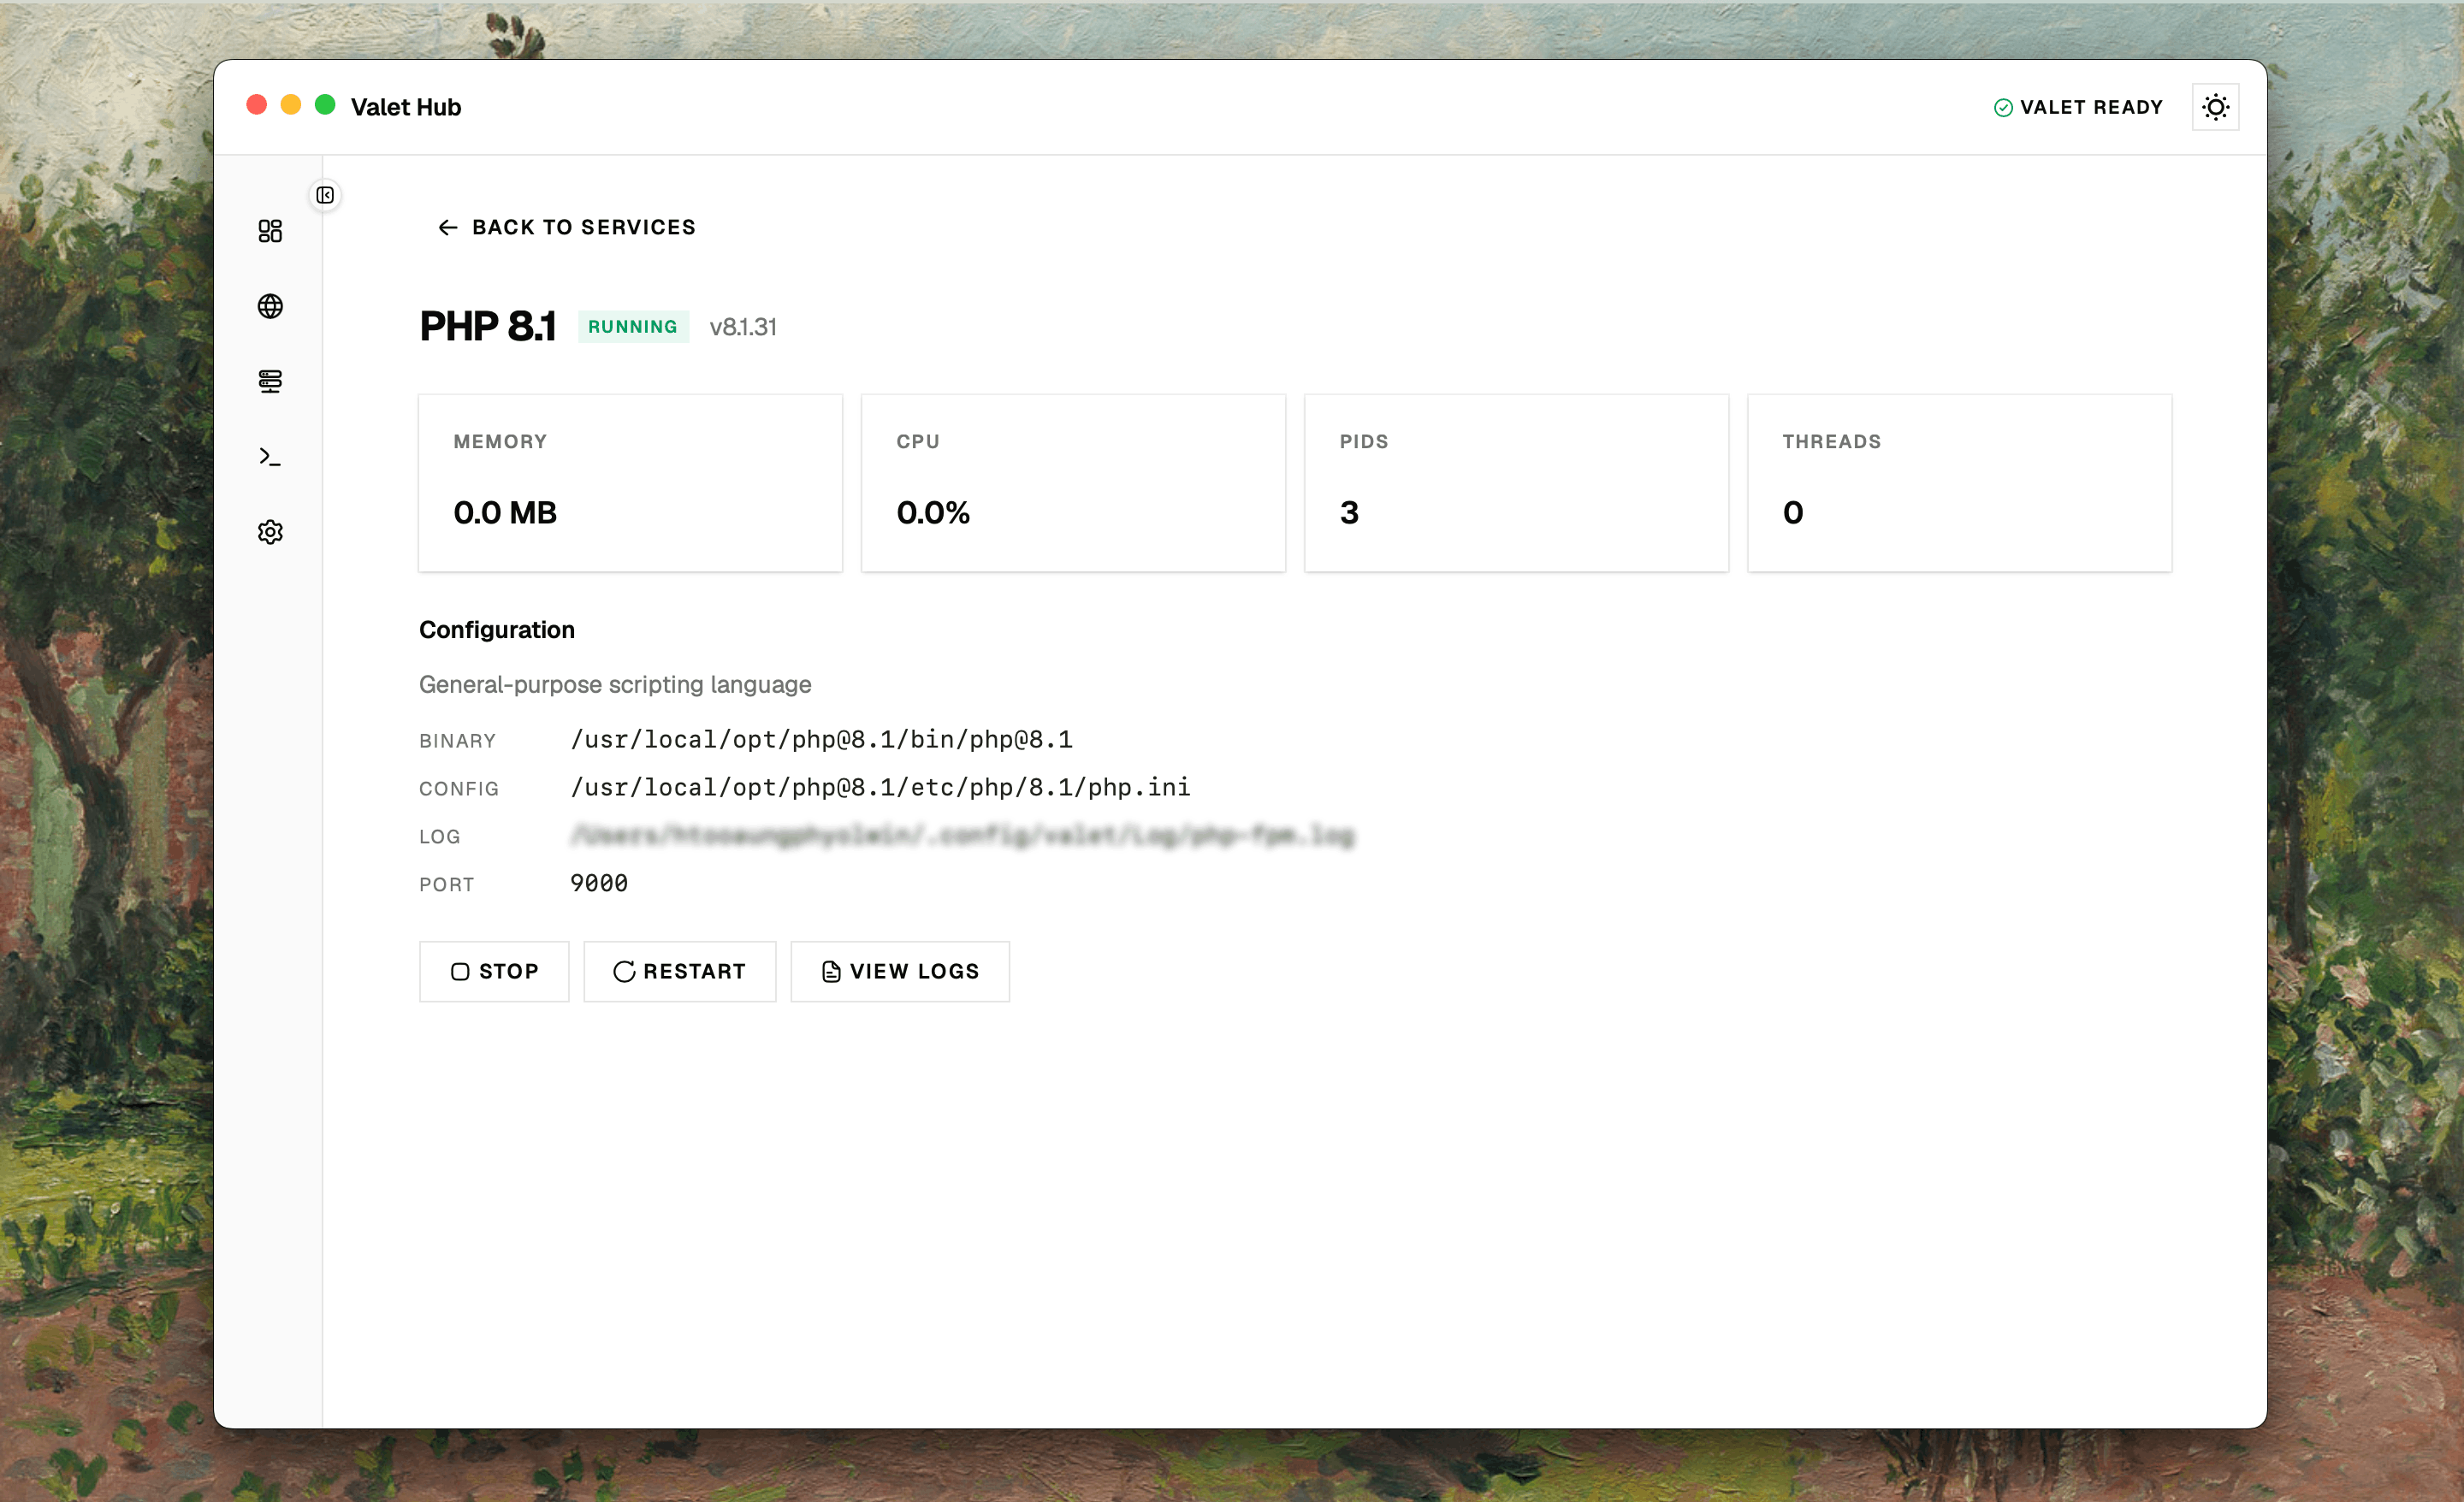
At the top, you'll see the service name with its status badge and version, and a back button to return to the service list.
Resource Usage
Four stat cards show what the service is doing right now:
- Memory — memory usage in MB, or
---if not available. - CPU — CPU usage as a percentage.
- PIDs — how many processes are running.
- Threads — thread count.
These are useful when you're investigating why a service is using more resources than expected.
Configuration
When available, a configuration section shows details about the service:
- Description — what the service does.
- Binary — the path to the service program.
- Config — the path to the configuration file (handy when you need to edit it manually).
- Log — the path to the log file.
- Port — the port number the service listens on.
This section hides when no configuration data is available.
Actions
From the detail page you can start, stop, or restart the service — just like on the list page. If a log path is available, a View Logs button takes you to the service's logs.
Service Logs
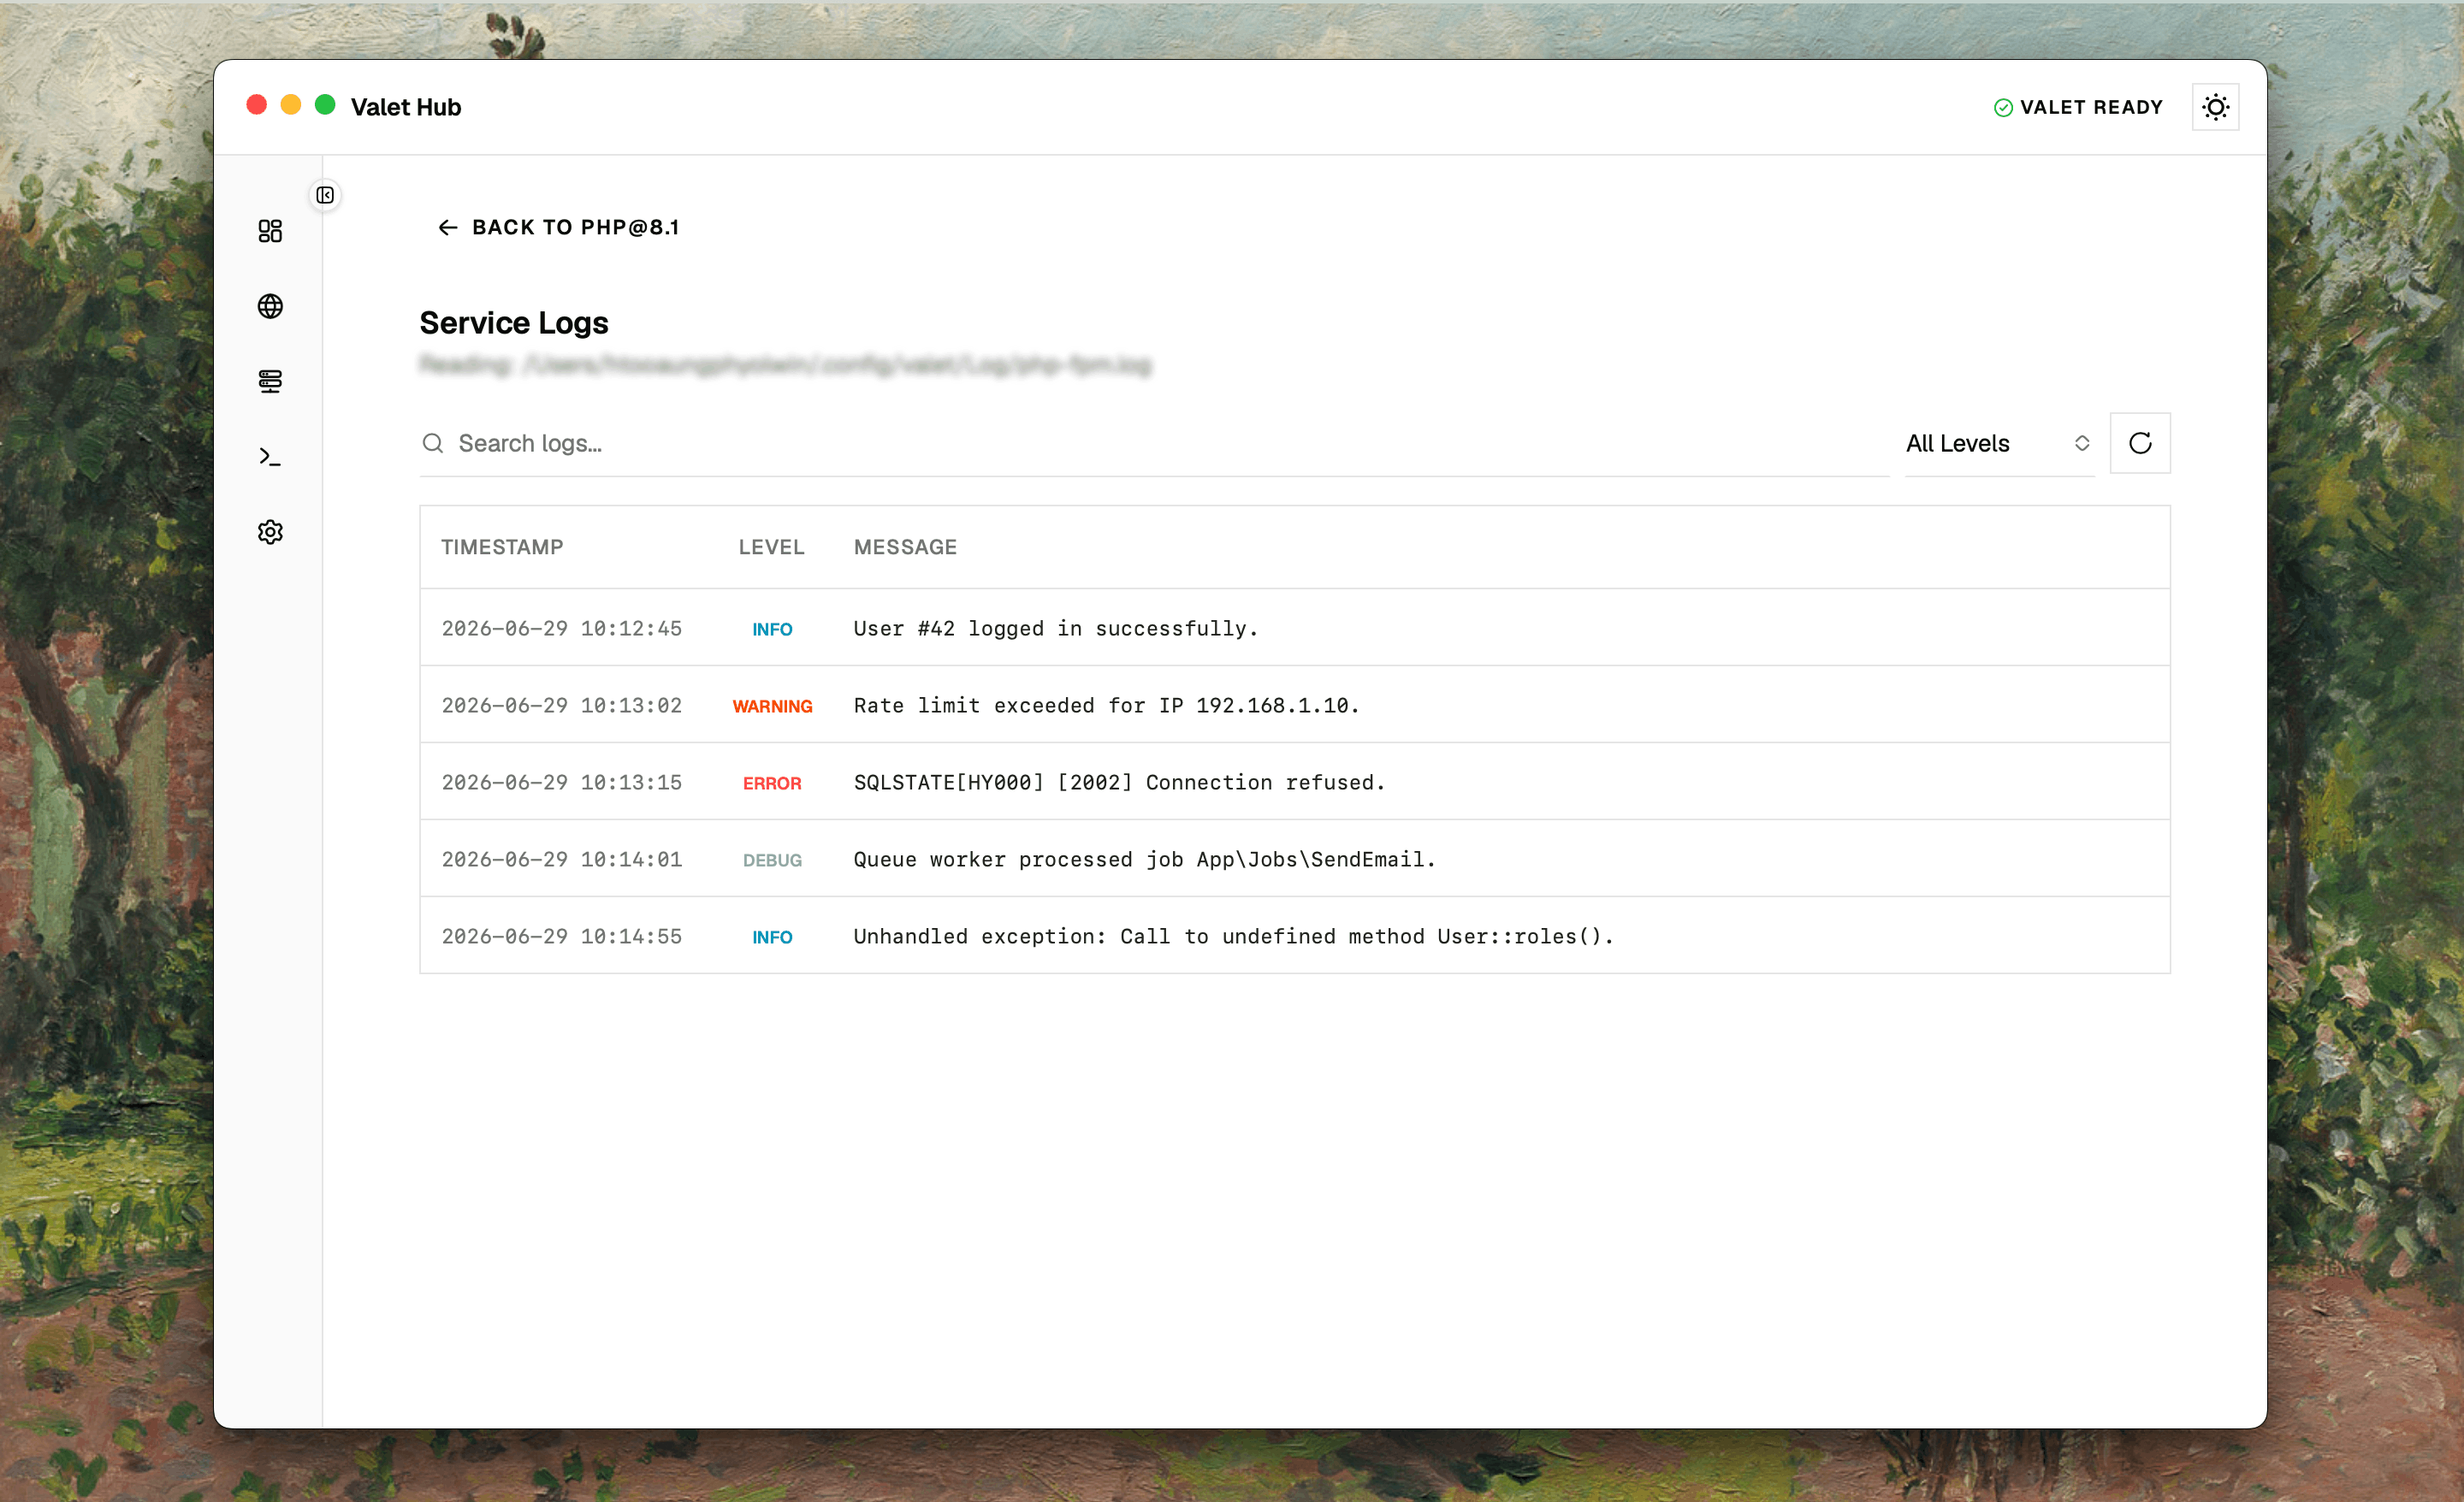
Open the log page from any service detail page. The full path to the log file is shown at the top — if no log file exists, a message explains why.
Finding What You Need
- Search — type to filter log entries by message content.
- Level filter — narrow down by severity level (error, warning, info, etc.).
- Refresh — reload the latest entries.
Log Table
Each entry shows a timestamp, a level badge, and the message. Click any entry to see the full message in a detail dialog — useful when a long error message is truncated in the table. You can copy the full message from there.
Pagination
Choose how many entries to show per page (50, 100, 200, or 500). Navigate between pages with the buttons below the table.